Gold Technical Analysis and Near-Term Outlook
This is a brief analysis for the next day or so. Our weekly Metals Commentary and daily updates are much more detailed and thorough energy price forecasts that cover key COMEX precious metals futures contracts and LME Non-Ferrous (Base) metals, spot gold, the gold/silver ratio, and gold ETFs. If you are interested in learning more, please sign up for a complimentary four-week trial.
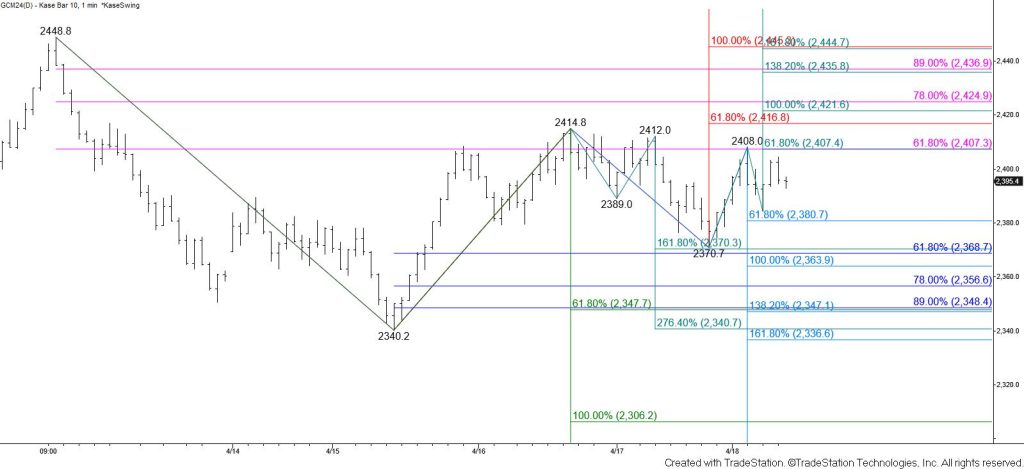
Gold has been trading in a small corrective range for the past few days. Last week’s late pullback from $2448.8 and the formation of weekly and daily shooting stars and daily weak bearish divergences warn that a reversal might still take place. However, prices are rising toward a key near-term target at $2419. Therefore, the pullback from $2448.8 will probably prove to be a short-lived correction. A move above $2407 will call for a test of $2419. Closing above $2419 will open the way for $2452, which then connects to $2473 and higher.
With that said, this is a tight call for the near term because given the bearish patterns and signals mentioned above there is still a reasonable chance for a test of key support at $2348. This is the smaller than (0.618) target of the wave down from $2448.8. Taking out $2381 will call for a test of $2365 and possibly $2348. Settling below $2348 will shift the near-term odds in favor of gold falling to $2306 and possibly lower.