Crude Oil Price Forecast – June 1, 2021

WTI Crude Oil Technical Analysis and Short-Term Forecast

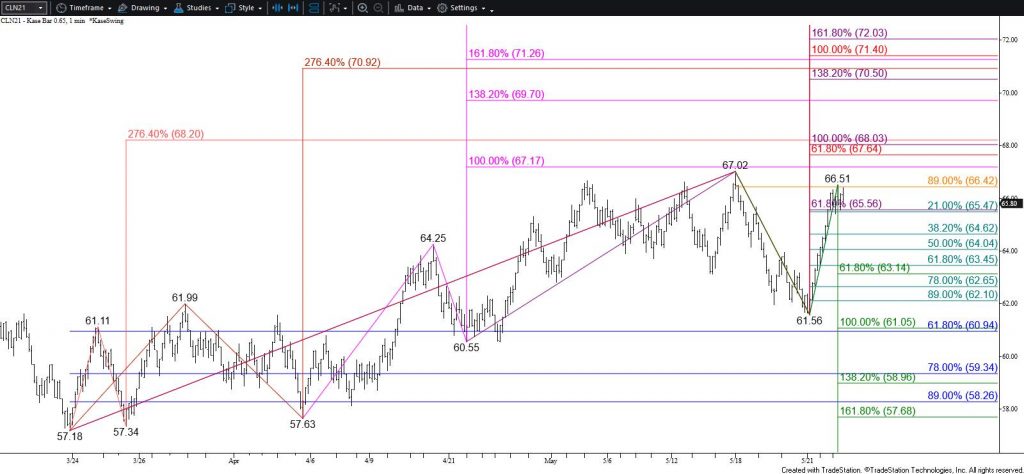
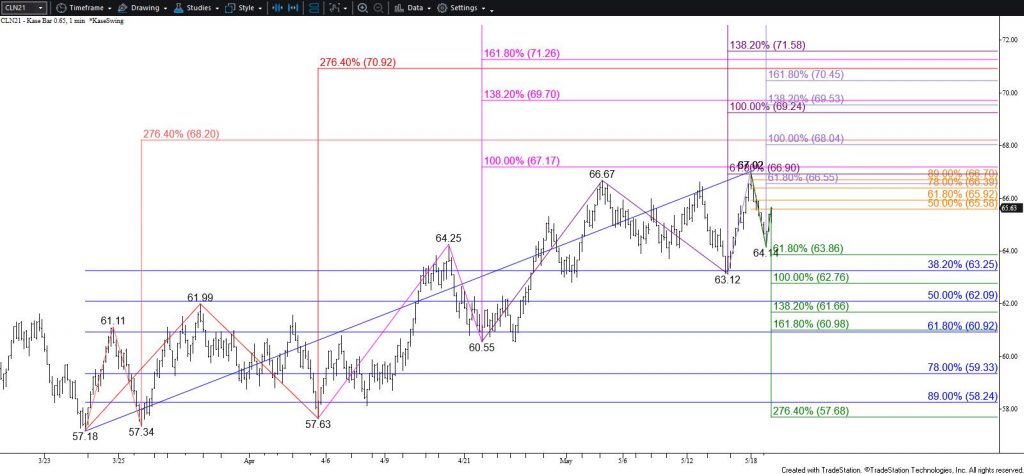
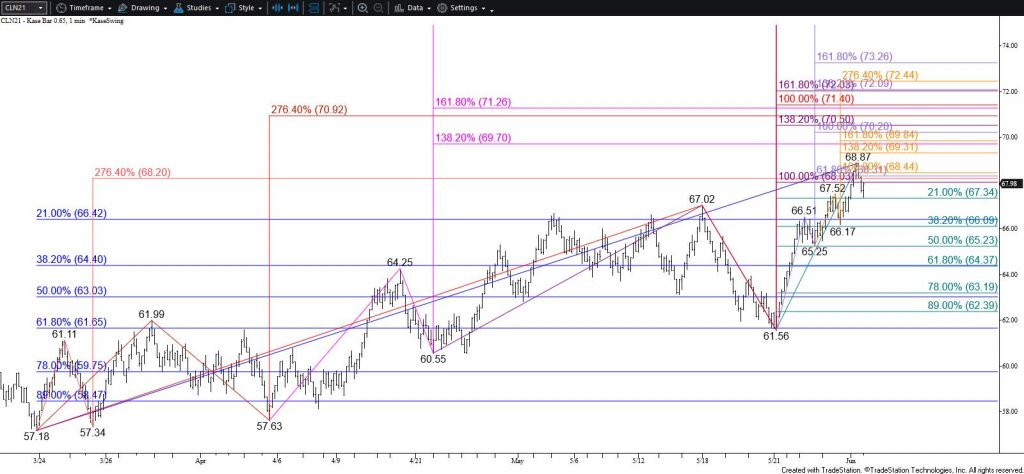
WTI crude oil rallied as expected after the holiday weekend. The move up briefly overcame an area of high confluence centered around $68.3 but stalled at $68.87. The subsequent pullback suggests a test of support might take place early tomorrow, but near-term odds favor a continued rise. Support at $66.7 is expected to hold and a move back above $68.3 will clear the way for the next major objective at $69.7 during the next few days.

Nevertheless, should WTI take out $66.7, look for a test of $65.4 and possibly $64.4. The $64.4 level is key for the near-term outlook because it is in line with the 38 percent retracement of the rise from $57.18 and the 62 percent retracement from $61.56. Closing above this would shift near-term odds in favor of a more significant test of support before the move up continues.

WTI Crude Oil - $0.65 Kase Bar Chart
WTI Crude Oil – $0.65 Kase Bar Chart

This is a brief analysis for the next day or so. Our weekly Crude Oil Forecast and daily updates are much more detailed and thorough energy price forecasts that cover WTI, Brent, RBOB Gasoline, Diesel, and spreads. If you are interested in learning more, please sign up for a complimentary four-week trial.

Natural Gas Technical Analysis and Near-Term Outlook

Natural gas overcame the $3.045 intra-day swing high today. This invalidated the prior primary wave down from $3.204 that had fulfilled its smaller than (0.618) at the $2.903 swing low. This is bullish for the near-term outlook and suggests that natural gas will now rise to challenge $3.09. This is the 62 percent retracement of the decline from $3.204. Closing above this would strongly imply that the corrective move down is complete and clear the way for a test of $3.15 and possibly $3.20.

With that said, the $3.045 swing high was only marginally overcome and there is now a new primary wave down from $3.204 that projects to $2.86 as the smaller than (0.618) target. Additionally, the move up from $2.903 lacks a meaningful primary wave. Therefore, there is still a reasonable chance of a deeper test of support or for prices to settle into a period of consolidation. Should natural gas take out $2.99 early tomorrow look for a test of $2.96, which, based on current technical factors is expected to hold. Key near-term support is $2.90, a close below which would call for a test of $2.86.

Natural Gas - $0.03 Kase Bar Chart
Natural Gas – $0.03 Kase Bar Chart

This is a brief analysis for the next day or so. Our weekly Natural Gas Commentary and daily updates are much more detailed and thorough energy price forecasts that cover key natural gas futures contracts, calendar spreads, the UNG ETF, and several electricity contracts. If you are interested in learning more, please sign up for a complimentary four-week trial.

WTI Crude Oil Technical Analysis and Short-Term Forecast

The near-term outlook for WTI crude oil is bullish due to the sustained close above the 62 percent retracement of the decline from $67.02 and the $65.56 smaller than (0.618) target of the compound wave up from $60.55. This wave calls for a test of $68.1, the connection to which is made through $67.4. Closing above $67.4 would also indicate that WTI has definitively overcome $67.0, which has been strong resistance for several weeks.

Nevertheless, today’s formation of a bearish doji dampens odds for reaching $67.4 and $68.1 tomorrow. This pattern also suggests a test of $64.8 might take place first. This level is expected to hold. Closing below $64.8 would complete the doji and call for a test of key near-term support at $63.3. This is in line with the 62 percent retracement of the rise from $67.02 and the smaller than target of the wave down from that same swing high. Closing below $63.3 is doubtful but would call for a deeper test of support before the move up continues.

WTI Crude Oil - $0.65 Kase Bar Chart
WTI Crude Oil – $0.65 Kase Bar Chart

This is a brief analysis for the next day or so. Our weekly Crude Oil Forecast and daily updates are much more detailed and thorough energy price forecasts that cover WTI, Brent, RBOB Gasoline, Diesel, and spreads. If you are interested in learning more, please sign up for a complimentary four-week trial.

Gold Technical Analysis and Near-Term Outlook

Gold has sustained a close above the 200-day moving average for the past four days. This is bullish for the outlook and suggests the market has adopted longer-term bullish sentiment. The challenge for the near-term is that bearish daily candlestick patterns and momentum signals indicate a test of support might take place before rising to challenge the next major objective at $1897.

Gold - $10 Kase Bar Chart
Gold – $10 Kase Bar Chart

Nevertheless, a move above $1885.3 early tomorrow will negate some of the downside risk by invalidating the intra-day wave down from $1891.3. Based on the wave structure, a move above $1885 should clear the way for $1897, a close above which will clear the way for $1910 and higher.

With that said, should gold take out the $1867 smaller than (0.618) target of the wave down from $1891.3 first, look for a test of at least $1856 and possibly $1846 during the next few days. Closing below $1856 will confirm the bearish candlestick patterns and settling below $1846 will confirm them. For now, $1846 is expected to hold, but settling below this will call for a deeper correction before the move up continues.

This is a brief analysis for the next day or so. Our weekly Metals Commentary and daily updates are much more detailed and thorough energy price forecasts that cover key COMEX precious metals futures contracts and LME Non-Ferrous (Base) metals, spot gold, the gold/silver ratio, and gold ETFs. If you are interested in learning more, please sign up for a complimentary four-week trial.

Natural Gas Technical Analysis and Near-Term Outlook

Natural gas continued to decline as expected today and settled back below $3.00 and the bottom of Monday’s gap. The pullback indicates that Monday’s rally to $3.15 was too much too soon. At this point, it looks as though natural gas will settle back into a trading range. The danger is that because of Monday’s failed rally, and due to confirmed bearish reversal patterns and signals, the pullback could overextend before finding a bottom.

With that said, given current technical factors, near-term odds favor a test of $2.92, a close below which will call for $2.88 and possibly $2.84. There is currently no strong evidence to call for a move below $2.84. However, closing below $2.84 would imply that the move down will likely extend to $2.76 and possibly lower before settling back into a trading range.

Natural Gas - $0.03 Kase Bar Chart
Natural Gas – $0.03 Kase Bar Chart

Nevertheless, the decline from $3.15 lacks a clear wave structure, and the move up from $2.94 at the end of today indicates a test of $3.02 might take place first. This level is expected to hold. Overcoming $3.02 would call for $3.07 and possibly $3.11. Settling above $3.07 would imply the pullback is complete. Closing above $3.11 would shift near-term odds back in favor of a continued rise to $3.17 and higher.

This is a brief analysis for the next day or so. Our weekly Natural Gas Commentary and daily updates are much more detailed and thorough energy price forecasts that cover key natural gas futures contracts, calendar spreads, the UNG ETF, and several electricity contracts. If you are interested in learning more, please sign up for a complimentary four-week trial.

WTI Crude Oil Technical Analysis and Short-Term Forecast

WTI crude oil rose to $67.0 as called for today and negated the double and triple top patterns that formed around $66.65. Today’s move also fulfilled the $67.0 smaller than (0.618) target of the subwave up from $60.55. This and other subwaves up from $57.18 now call for an extension to at least $68.1 during the next few days. The connection to $68.1 is made through the $66.6 smaller than target of the wave up from $63.12, which projects to $68.1 as the equal to target.

Nevertheless, today’s pullback suggests the move up will remain a grind. Choppy trading conditions and wide swings are anticipated. Even so, should WTI take out $63.9 before reaching $66.6 look for a test of key near-term support at $62.9. Closing below this will call for a deeper test of support before the move up continues.

WTI Crude Oil - $0.65 Kase Bar Chart
WTI Crude Oil – $0.65 Kase Bar Chart

This is a brief analysis for the next day or so. Our weekly Crude Oil Forecast and daily updates are much more detailed and thorough energy price forecasts that cover WTI, Brent, RBOB Gasoline, Diesel, and spreads. If you are interested in learning more, please sign up for a complimentary four-week trial

Gold Technical Analysis and Near-Term Outlook

Gold is struggling to reach the next major objective at $1857 after briefly overcoming the $1837 target of the confirmed $1676 double bottom. A small double top around $1846.3/$1844.7 has formed but the $1817.8 confirmation point of this pattern has held so far. The pullback from $1846.3 looks corrective and the outlook for gold in the coming weeks remains bullish. However, there is still downside risk, which makes this is an extremely tight near-term call for the next few days.

Should gold overcome $1832 early tomorrow look for a test of $1842. Settling above $1842 will clear the way for $1857, which then connects to $1874 and higher.

Conversely, should gold take out $1815 first, look for $1804 to be challenged. Closing below $1815 will confirm the double top and settling below $1804 will call for a test of the double top’s $1788 target. At this point, there is no strong evidence to call for a move below $1788.

Gold - $10 Kase Bar Chart
Gold – $10 Kase Bar Chart

This is a brief analysis for the next day or so. Our weekly Metals Commentary and daily updates are much more detailed and thorough energy price forecasts that cover key COMEX precious metals futures contracts and LME Non-Ferrous (Base) metals, spot gold, the gold/silver ratio, and gold ETFs. If you are interested in learning more, please sign up for a complimentary four-week trial.

Natural Gas Technical Analysis and Near-Term Outlook

Natural gas has been trading in a very indecisive manner for the past few weeks. A complex head and shoulders pattern has taken shape and would be confirmed by a close below $2.88. However, this pattern looks as though it will fail because the right side of the head and shoulders forms a bullish expanding wedge. June natural gas is challenging the upper trend line of this pattern this afternoon. Moreover, the small intraday wave up from $2.881 met its smaller than (0.618) target this afternoon and is now poised to reach $3.02. This is the most confluent target on the chart, so $3.02 could prove to be another stalling point. However, closing above $3.02 will clear the way for $3.07 and likely $3.13.

Natural Gas - $0.03 Kase Bar Chart
Natural Gas – $0.03 Kase Bar Chart

Nevertheless, the top of the right shoulder of the head and shoulders pattern at $2.989 has held as of this analysis (marginally). Should June natural gas take out $2.95 early tomorrow look for a test of $2.91, which then connects to $2.86. Closing below $2.86 would also take out the $2.88 neckline of the head and shoulders and shift near-term odds in favor of a deeper test of support.

This is a brief analysis for the next day or so. Our weekly Natural Gas Commentary and daily updates are much more detailed and thorough energy price forecasts that cover key natural gas futures contracts, calendar spreads, the UNG ETF, and several electricity contracts. If you are interested in learning more, please sign up for a complimentary four-week trial.

WTI Crude Oil Technical Analysis and Short-Term Forecast

The near-term outlook for WTI crude oil leans bullish headed into tomorrow. Today’s early decline to $63.68 negated the double bottom that formed around $63.9 yesterday. However, the subsequent move up from $63.68 formed a wave that overcame its smaller than (0.618) target and is poised to reach $65.9. Such a move will overcome the 62 percent retracement of the decline from $66.76, fulfill the smaller than target of the compound wave up from $62.9, and most importantly, overcome the $65.75 intraday swing high, thus invalidating the primary wave down from $66.76. Overcoming $65.9 will also increase odds for a test of the $66.76 swing high, which then connects to a crucial target at $67.7.

WTI Crude Oil - $0.65 Kase Bar Chart
WTI Crude Oil – $0.65 Kase Bar Chart

Nevertheless, the near-term call remains tight. This is because while the $65.75 swing high holds there is still a reasonable chance for the primary wave down from $66.76 to extend. This wave has already taken out its smaller than target and projects to $63.0 as the equal to (1.00) target. Therefore, should $65.75 hold, and WTI falls below $64.1 to invalidate the wave up from $63.68, look for a test of $63.0. This is also the 38 percent retracement of the rise from $57.29. A “normal” correction should hold $63.0. Closing below this would reflect a stronger bearish shift in near-term sentiment and call for a deeper test of support before the move up continues.

This is a brief analysis for the next day or so. Our weekly Crude Oil Forecast and daily updates are much more detailed and thorough energy price forecasts that cover WTI, Brent, RBOB Gasoline, Diesel, and spreads. If you are interested in learning more, please sign up for a complimentary four-week trial.

Gold Technical Analysis and Near-Term Outlook

Gold rallied again and settled above the highly confluent $1806 larger than (1.618) target of the primary wave up from $1676.2. The outlook is firmly bullish headed into tomorrow. The move up is now poised to challenge at least $1827 and likely $1837 during the next few days. The $1837 objective is another highly confluent wave projection and the target of the $1676 double bottom. Settling above $1837 might initially prove to be a challenge but would clear the way for $1857 and higher.

A few daily momentum oscillators are set up for bearish divergence but both momentum and price will have to peak to confirm these signals. Otherwise, there are no major bearish patterns or confirmed signals that call for a reversal. Even so, should gold pullback tomorrow look for today’s $1801 midpoint to hold. Key near-term support is $1787, a close below which would shift near-term odds in favor of a deeper test of support before the move up continues.

Gold - $5 Kase Bar Chart
Gold – $5 Kase Bar Chart

This is a brief analysis for the next day or so. Our weekly Metals Commentary and daily updates are much more detailed and thorough energy price forecasts that cover key COMEX precious metals futures contracts and LME Non-Ferrous (Base) metals, spot gold, the gold/silver ratio, and gold ETFs. If you are interested in learning more, please sign up for a complimentary four-week trial.