Midweek Natural Gas Forecast – April 1, 2015

Natural gas had been supported by late winter weather in regions of the U.S. through late last week. However, as expected, natural gas prices finally broke lower out of the large scale corrective pattern that formed during the calendar month of March. The move down is poised to continue, but in the very short term, there may be a small pullback first.

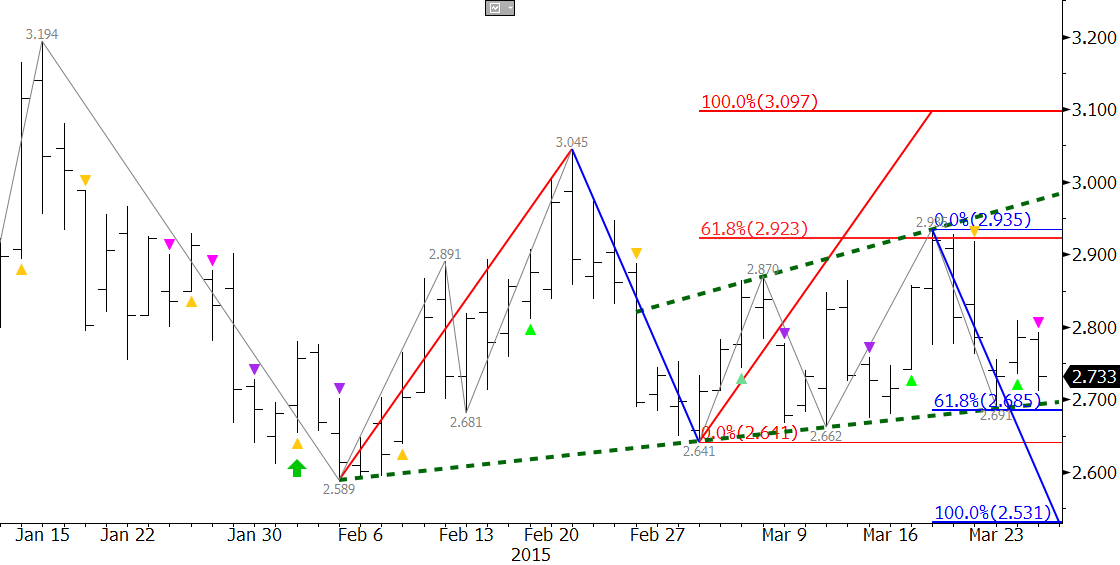
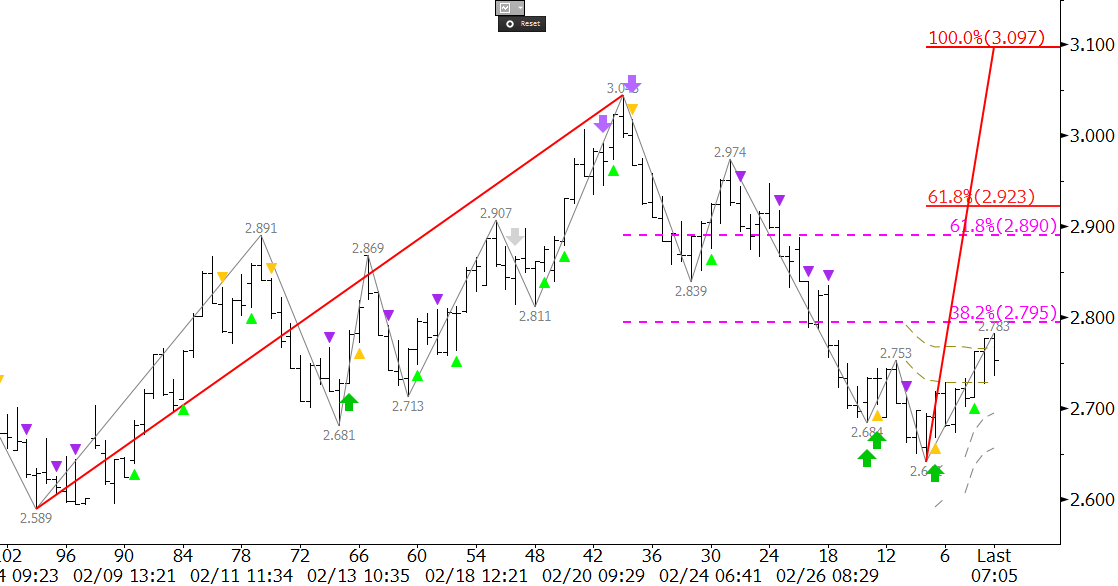
The May futures contract broke out of another small bearish flag this morning on the 240-minute equivalent Kase Bar chart and fell to a new contract low of $2.583. This is an important area of support, and a potential short term stalling point because May’s $2.583 low is in line with the 1.00 target for the move down from $2.949 (as shown in the chart above), and is also near the continuation chart’s swing lows of $2.567 and $2.578. In addition, a bullish KasePO divergence (green trend line) was confirmed this morning.

Natural Gas Prices

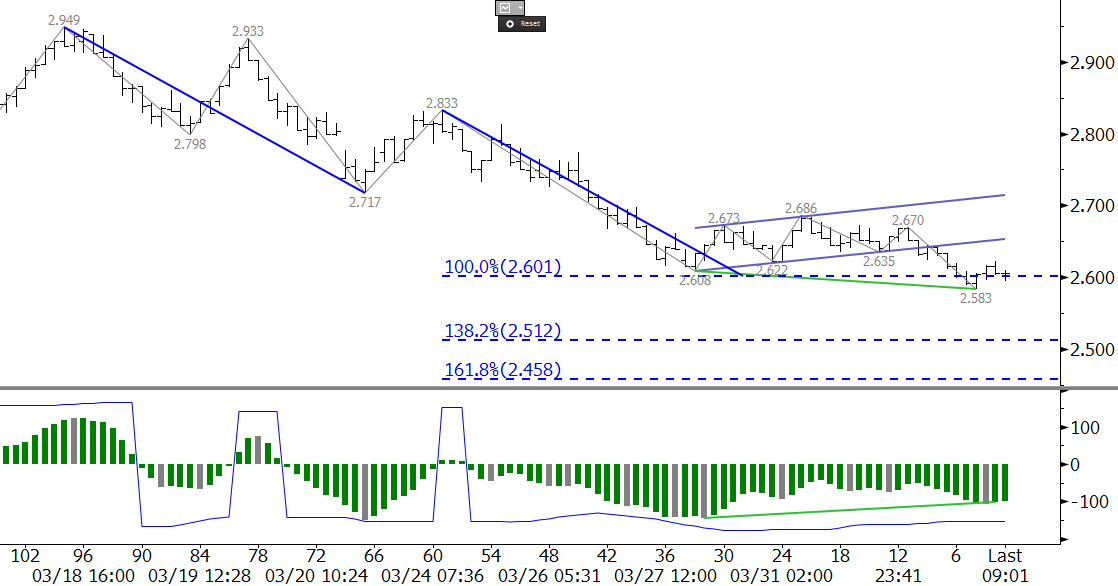
All of these factors are positive for the very short term. They indicate that a pullback may take place ahead of tomorrow’s U.S. Energy Information Administration (EIA) Natural Gas Weekly Update. However, the longer-term technical and fundamental factors indicate resistance should hold and that the move down will extend. Once natural gas prices have definitively broken support between $2.57 and $2.60, look for $2.51 and $2.46, the latter of which is also the 0.618 projection of the compound wave $2.949 – 2.608 – 2.686.

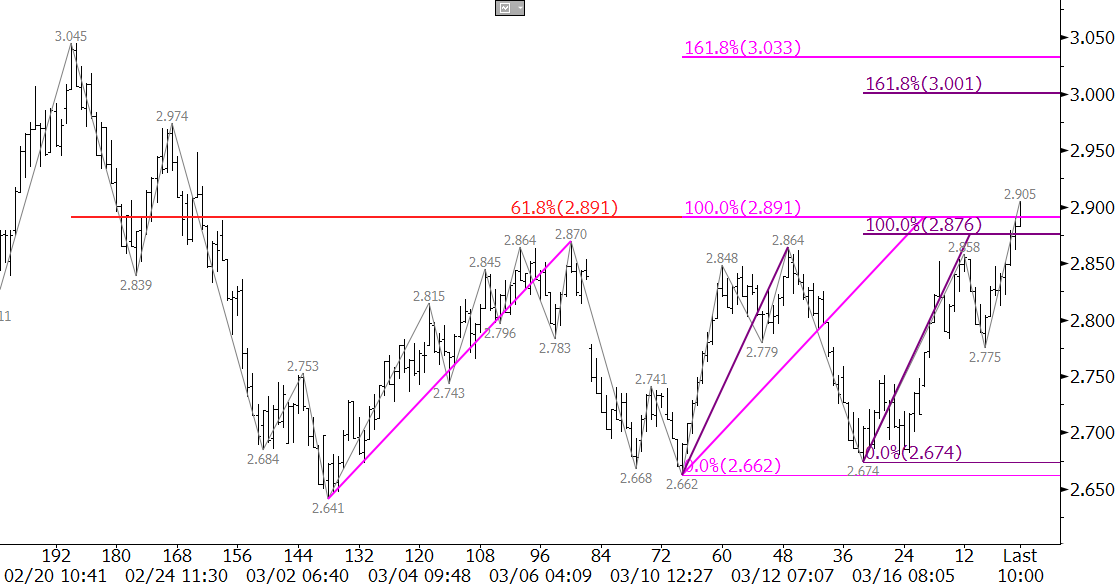
Look for resistance at $2.65 to hold. This is the 21 percent retracement of the decline from $2.949 and is near the lower trend line of the small bearish flag that broke lower this morning. Even a pullback to $2.72, which is the 38 percent retracement, would be considered a normal correction. A close over $2.72 is doubtful without a bullish surprise from external factors.


Take a trial of Kase’s more in-depth weekly energy forecasts.

Brent crude’s failure to close above the $57.5 completion point of the weekly morning star setup (circled in green) was negative and indicates the geopolitically driven move up that took place last week may be short lived. The Brent crude price rose modestly on Monday, but most short-term technical factors indicate it should test $53.1 again. A close below this would call for $49.2, which is the last target protecting the $48.95 contract low.

Look for resistance at $57.5 and $60.05. A close over the latter would open the way for the $63.66 swing high to be challenged.

Take a trial of Kase’s weekly WTI and Brent Crude Oil Price Forecast.

Brent Crude Prices

Natural gas prices are still oscillating in the upward sloping range that began March 3 when the $2.641 swing low was made. The lower trend line of the formation, which connects back to the $2.589 contract low, was tested, but held again on Monday. Most pundits indicate the long-term fundamentals are bearish, but this begs the questions, why hasn’t the market broken lower yet? This is one of many areas that technical analysis can help answer that question and give us a good idea of where the market will go once it breaks out of this range.

The chart below tells us everything we need to know about the outlook for natural gas in the near term, and can give us an idea about the longer-term outlook too. This is a very short-term analysis, so we will focus on those factors. Technical factors are showing that the market does agree with the bearish fundamentals, and that a break lower should take place soon, but that there are still enough positive factors like late winter weather in the Northeast to support prices for now.

Natural Gas Forecast

The range that has formed over the past few weeks is an expanding wedge (shown in green), and a break out of this pattern will solidify direction for natural gas prices. The break out points for the pattern at $2.69 and $2.94 are in line with the 0.618 projections for the wave up from $2.589 (show in in red) and down from $3.045 (shown in blue). The confluence of these points tells us that a close below $2.69 would open the way for the 1.00 projection of $2.53, and a close over $2.94 would call for an extended correction to $3.10.

The expanding wedge and the Fibonacci wave projections give us a solid forecast once the market breaks out of the wedge. The wedge is a corrective pattern, and because the market entered the pattern after declining from $3.045, a break lower out of the wedge is favored. The negative bias is also confirmed by the KaseX’s most recent yellow and pink down triangles.

In summary, the near-term outlook is negative and a bearish U.S. Energy Information Administration (EIA) Natural Gas Weekly Update tomorrow would likely be the catalyst to achieve the expected break lower out of the expanding wedge. A close below $2.69 will confirm the break lower and call for at least $2.53. Conversely, a close over $2.94 would call for an extended correction to $3.10.

Take a trial of Kase’s in-depth weekly Natural Gas Forecast.

Take a trial of the KaseX trading indicator.

WTI crude oil rose for a second straight day due to the declining dollar. The long-term bias is still negative, so the move up is corrective. However, mixed fundamental and technical factors indicate the correction should extend to at least $48.2 before settling into another trading range. This is the 1.00 projection for the wave up from $44.03 and the 38 percent retracement of the decline from $54.0. A close over $48.2 would call for $50.4, the 1.618 projection and the 62 percent retracement. Look for immediate support at the $45.33 and $44.77 swing lows.

Take a trial of Kase’s weekly energy forecasts.

WTI Crude Oil

During the calendar month of March the April natural gas futures contract has traded in a range bound between $2.64 and $2.87. Most fundamental and technical factors are still negative for the long-term. The move up at this point is still corrective and will only delay the inevitable decline that is ultimately coming. However, late winter weather concerns continue to support the market and have rattled the nerves of traders enough over the past two days to push natural prices above $2.87 to challenge key resistance at $2.89 ahead of tomorrow’s U.S. Energy Information Administration (EIA) Natural Gas Weekly Update.

The market is hinting that a bullish EIA update may be expected, but if the number is disappointing, this natural gas price rise will collapse in upon itself and could be the catalyst the finally push prices lower to challenge key support targets.

The wave formations up from $2.589 (not shown), $2.641, $2.662, and $2.674 all show that $2.89 is a confluent wave projection. It is also the 62 percent retracement from $3.045 to $2.641. The confluence of wave projections and retracements at $2.89 make it the key decision point for an extended correction to at least $3.00 and possibly $3.07. At the time of this analysis, natural gas prices are trading right at $2.89, but they will need to settle above this to open the way for $3.00 in early trading tomorrow before the EIA update is released. Unless the EIA report is extremely bullish, it is doubtful that prices will settle above $3.07 in coming days.

natural gas forecast

Look for support at $2.78. This is in line with the $2.775 swing low, the midpoint of the recent range between $2.64 and $2.87, and the midpoint of the March 12 and 17 candlesticks. A close below $2.78 would indicate the move up has failed to extend once again.

Take a trial of Kase’s in-depth weekly energy price forecasts.

NY Harbor ULSD futures fell to a new intraday low for the eighth session in a row, but formed a bullish morning star setup and hammer. These are bullish reversal formations, but in this case it is more likely that a subsequent move up will be a correction rather than a reversal. In addition, the decline stalled near the 62 percent retracement of the move up from 154.8 to 197.86, which supports the likelihood of a correction. However, the KasePO and KaseCD show that the decline should ultimately continue. Look for resistance at 178.7 and no higher than 186.0 to hold.

Take a trial of Kase’s energy forecasts.

ULSD futures

Natural gas prices are still oscillating in the corrective range between approximately $2.60 and $3.00. Early in the week it looked as though natural gas prices were ready to continue the decline. However, while there is little doubt that the long-term bias is negative, Wednesday’s price rise has called into questions how soon natural gas prices will fall to new contract lows.

Monday’s gap from $2.783 was filled early Wednesday and then April futures overcame the 0.618 projection at $2.80 for the wave up from $2.641. The $2.80 level was also near the 62 percent retracement of the decline from $2.87 to $2.662. The confluence of the wave projection and retracement at $2.80 makes it a crucial decision point for the near term outlook. Should natural gas prices close over $2.80, look for at least $2.89 because it is the 1.00 projection. This level is most important because it is also the 62 percent retracement from $3.045 to $2.641, the 0.618 projection for the wave up from $2.589 (not shown), and is in line with last weeks $2.87 swing high. A close over $2.89 would open the way for an extended correction and would further delay a decline to new contract lows.

natural gas prices

The first class long permissions (blue dots) for the Kase Easy Entry System (KEES) indicate the move up will likely continue, and that $2.89 should at least be tested tomorrow. However, the bearish KCDpeak (red K above 2.848) indicates the move up is already overbought on the 120-minute equivalent Kase Bar chart. A move above $2.848 would negate the KCDpeak, and as long as the KEES permissions remain long (blue dots) the near-term bias will remain positive.

Look for support at $2.73. A close below this over the next few days would shift the near-term bias back to negative and call for the $2.641 swing low to be challenged.

Learn more information about Kase’s energy price forecasts.
Learn more about KEES, which is part of Kase StatWare.

April gasoline prices fell for the fourth day in a row, but held support at 185.0. The bearish KaseCD divergence and underlying short permissions (red dots) indicate the decline should continue to 180.0. A normal correction will hold 180.0 because it is the 38 percent retracement of the move up from 149.64 and the 1.618 projection for the intraday wave down from 198.93 (not shown). A close below 180.0 would call for the 62 percent retracement at 168.5. This level must hold for gasoline prices to retain any chance at a continued recovery in the near term.

Learn more about Kase’s energy forecasts.

gasoline prices

Cold weather continues to support natural gas, but the wide sweeping frigid conditions have not been enough of an influence to drive prices higher. Fundamental and technical factors leave little doubt that the outlook for the next several months is bearish, but for now, natural gas prices are stuck in a trading range bound between approximately $2.55 and $3.00.

Prices fell last week after the disappointing U.S. Energy Information Administration (EIA) Natural Gas Weekly Update, and a swing low of $2.641 was made on Tuesday. The $2.80 midpoint of last Thursday’s candlestick held Wednesday morning, which may be an early indication that another disappointing EIA update is expected tomorrow. The $2.80 level is confluent resistance because it is also the 38 percent retracement of the decline from $3.045 to $2.641.

There are a few short term positive factors (green arrow and triangle) triggered by KaseX on the $0.05 KaseBar chart, and a close over $2.80 would open the way for key resistance at $2.90. The $2.90 level is the 62 percent retracement from $3.045 and the 0.618 projection for the wave $2.589 – 3.045 – 2.641. This is crucial, because waves that overcome the 0.618 projection typically extend to at least the 1.00 projection, in this case $3.10. We expect $2.90 to hold, but a close over this level would shift near term odds in favor of another attempt at $3.10 and higher.

Natural Gas Forecast

First support is $2.70, and a move below this would call for the $2.641 swing low and $2.589 contract lows to be challenged. The most important target is still $2.55, because the technical show that it is the gateway objective for a decline into the low $2s. It will likely be at least a few more weeks before prices close below $2.55.

So for now, our analysis leads us to believe that a near term test of resistance at $2.80 and possibly $2.90 will take place, but that $2.90 will hold and prices will continue to oscillate in a sideways range.

Kase Bars are available on TradeStation and Bloomberg.

Take a trial of Kase’s in-depth weekly Natural Gas Forecast or of KaseX.

Since late 2011 the Korean Stock Exchange (KOSPI) has oscillated in a narrowing range, now nearing its apex, which means a breakout is expected within the next quarter or two, perhaps sooner.

The pattern began after 2011’s decline to 1644.11. The entire pattern could be the middle “B” wave of a downward ABC correction, or, alternatively the first wave of a renewed push higher. This will remain an open question until there’s a break out, but recent technicals call for a test the formation’s upper trend line. So odds may indeed favor a break higher.

KOSPI Monthly
KOSPI Forecast Monthly

The first positive factor is a bullish piercing pattern that formed after a test of the pennant’s lower trend line, when January opened below December’s close and closed above December’s midpoint. If February, now trading slightly over December’s 1971.95 open, closes above that point, the bullish tone will be confirmed.

The next bullish factor for this KOSPI forecast can be seen on the daily chart, in red. This is a five-wave trending pattern that met a major target at 1970.27 (the top of Wave 3), and is now poised to extend to key endpoint targets for Wave 5, at 2039.6. Early in the move up a strong buy signal called a pierced dart (two green up arrows and yellow triangle) triggered on the KaseX trading study.

KOSPI Daily
KOSPI Forecast Daily

Hitting 2039.6 would be extremely important because the KOSPI Index would have overcome the top of Wave B, marked in blue. To be considered complete, waves must extend to at least their 0.618, or smaller than, projection. This value was met at 1876.27. Kase’s studies show that just 13 percent of waves stall at this level, the remainder go on to meet their equal to, or 1.0 projection. Overcoming 1994.82 would wipe out Wave C. At that point, the entire wave down from 2093.08 would have to extend down as a whole. Alternatively the wave would be considered complete at the minimum extension, potentially a bearish technical failure.

A bearish failure often results in a sharp rise. Therefore, overcoming 1994.82 could be the catalyst that the KOSPI Index needs to make a decisive upward move.

2039.6 has about 2/3rds odds to be met, and would likely trigger connections to 2158.2 from the waves up from 1644.11. At that point, the resistance line will have been broken. Waves up from 892.16, which also point to 2158.2, might then extend to higher targets at 2336.2 and 2484.3.

In summary, while KOSPI has been oscillating in a neutral range, 2039.6 is the key for an upside test. There could be a pullback at 2039.6, but a sustained close over this, calls for 2158.2, above the upper trend line. A sustained close over this would confirm a valid break higher and open the way for the 2336.2 and 2484.3 targets.

Learn more about Kase’s trading indicators KaseX and Kase StatWare that were used for this KOSPI forecast.

Take a trial of Kase’s weekly energy forecasts that use the same techniques as this KOSPI forecast.