Natural Gas Price Forecast – August 4, 2021

Natural Gas Technical Analysis and Near-Term Outlook

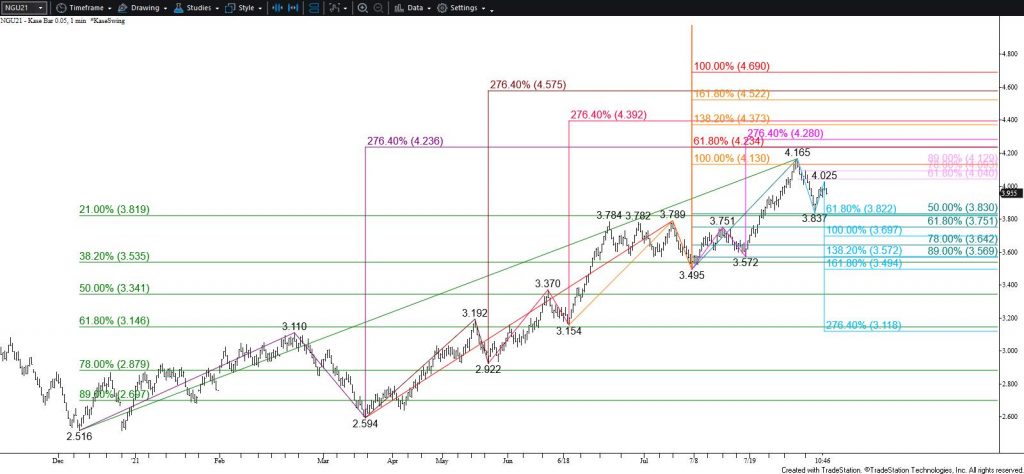
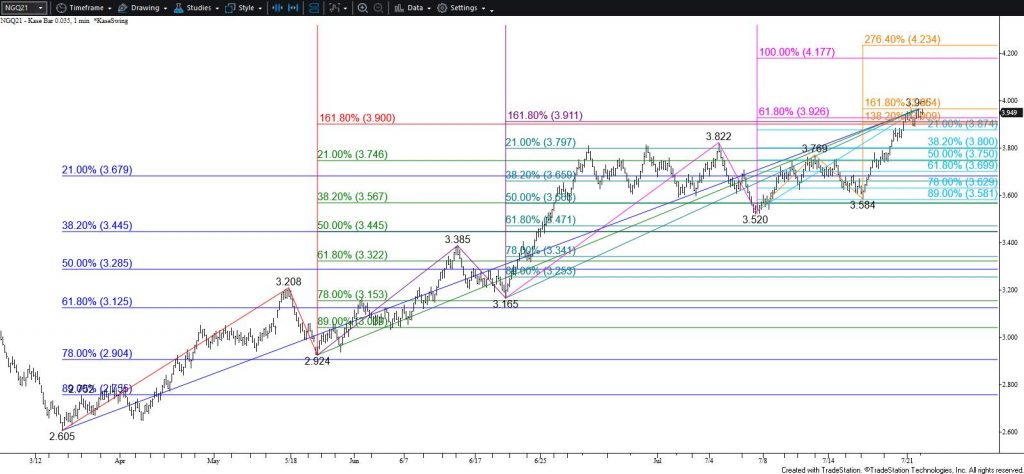
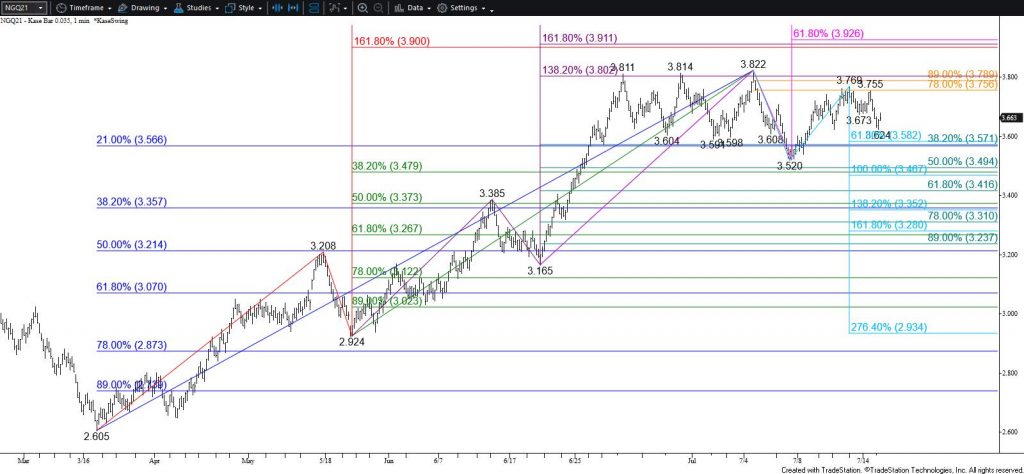
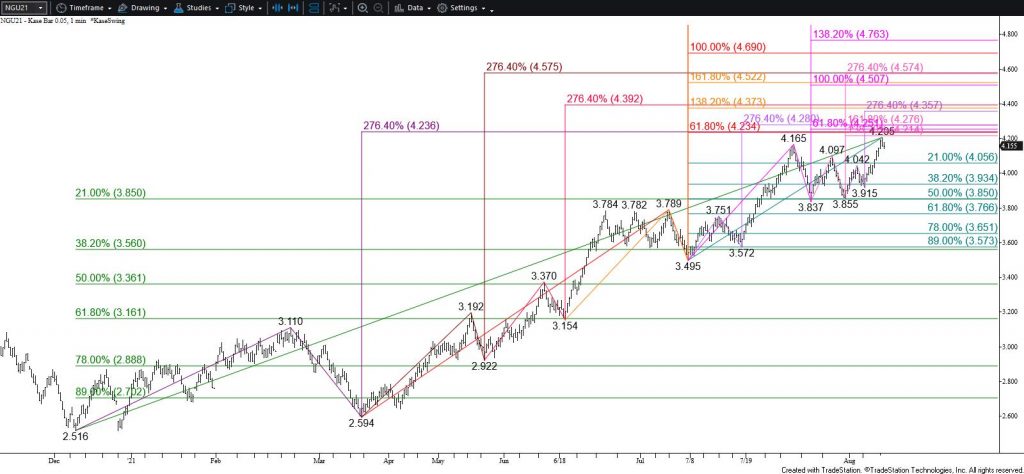
Natural gas rose to a new high of $4.205 and stalled just below the next major objective at $4.24. This is the most confluent target on the chart and a key projection for many of the largest and most important waves and subwaves up from the $2.516 swing low. Given the confluent and importance of $4.24, this could prove to be another stalling point. However, once met an eventual close above $4.24 is anticipated. Such a move will clear the way for a push toward $4.51 in the coming weeks.

With that said, while the pullback from $4.205 might have been profit-taking toward the end of the day the move warns that a test of at least $4.13 and possibly $4.06 could take place first. Without a sudden bearish shift in supply/demand factors, $4.06 is expected to hold. Key support and the barrier to a bearish near-term outlook is $3.98. Settling below $3.98 will clear the way for $3.93 and possibly $3.85 instead.

Natural Gas - $0.05 Kase Bar Chart
Natural Gas – $0.05 Kase Bar Chart

This is a brief analysis for the next day or so. Our weekly Natural Gas Commentary and daily updates are much more detailed and thorough energy price forecasts that cover key natural gas futures contracts, calendar spreads, the UNG ETF, and several electricity contracts. If you are interested in learning more, please sign up for a complimentary four-week trial.

WTI Crude Oil Technical Analysis and Short-Term Forecast

WTI crude oil stalled at $69.19 and formed a daily bullish hammer. Today’s prices action was lackluster compared to Monday’s sell-off and suggests that the move down will probably prove to be another short-lived correction. Moreover, the wave formation up from $69.19 calls for a test of at least $71.5, which then connects to $72.5. For the move down to extend again during the next few days $72.5 must hold. Closing above this will complete the hammer, overcome the 62 percent retracement of the decline from $74.2, and call for a test of the hammer’s $73.9 confirmation point.

With that said, today’s hammer is not enough to definitively state that the move down is complete. Falling below $69.8 before overcoming $71.5 will call for a test of $68.5. This is a crucial level because it is the 62 percent retracement of the rise from $65.01. Taking out $68.5 will significantly dampen odds for a continued rise and call for key support at $67.6 to be challenged. This threshold is split between the smaller than (0.618) target of the waves down from $76.07 and $74.2. Settling below $67.6 will open the way for $65.9 and likely lower in the coming days.

WTI Crude Oil - $1.00 Kase Bar Chart
WTI Crude Oil – $1.00 Kase Bar Chart

This is a brief analysis for the next day or so. Our weekly Crude Oil Forecast and daily updates are much more detailed and thorough energy price forecasts that cover WTI, Brent, RBOB Gasoline, Diesel, and spreads. If you are interested in learning more, please sign up for a complimentary four-week trial.

Gold Technical Analysis and Near-Term Outlook

Gold rallied and settled above the 200-day moving average and the larger than (1.618) target of the wave up from $1789.1. This was bullish for the outlook and infers that the corrective pullback from $1835 is complete. There is still immediate resistance around $1835 but the wave formations now call for $1842 and $1855. Furthermore, settling above $1842, which is the smaller than (0.618) target of the wave up from $1750.1, will open the way for $1874 and higher.

With that said, the 50-day moving average held and the wave up from $1789.1 is due for a pullback before rising much higher. Today’s $1819 midpoint is expected to hold and $1805 is key support for the near term. Settling below $1805 would shift odds back in favor of $1784 and possibly lower.

Gold - Daily Chart
Gold – Daily Chart

This is a brief analysis for the next day or so. Our weekly Metals Commentary and daily updates are much more detailed and thorough energy price forecasts that cover key COMEX precious metals futures contracts and LME Non-Ferrous (Base) metals, spot gold, the gold/silver ratio, and gold ETFs. If you are interested in learning more, please sign up for a complimentary four-week trial.

Natural Gas Technical Analysis and Near-Term Outlook

The near-term outlook for natural gas is bearish. Today’s long-legged doji reflects a bit of uncertainty, but the waves down from $4.165 and $4.025 call for a test of at least $3.91 and likely lower during the next few days. The key near-term objective is $3.82 because this is the smaller than (0.618) target of the primary wave down from $4.165. Settling below $3.82, which is also in line with the 50 percent retracement of the rise from $3.495, will clear the way for $3.75 and eventually $3.70.

Nevertheless, the 38 percent retracement of the rise from $3.837 has held so far. Should natural gas rally above $4.04 look for a test of key near-term resistance at $4.08. Settling above $4.08 will shift odds back in favor of rising toward the next major threshold around $4.23.

Natural Gas - $0.05 Kase Bar Chart
Natural Gas – $0.05 Kase Bar Chart

This is a brief analysis for the next day or so. Our weekly Natural Gas Commentary and daily updates are much more detailed and thorough energy price forecasts that cover key natural gas futures contracts, calendar spreads, the UNG ETF, and several electricity contracts. If you are interested in learning more, please sign up for a complimentary four-week trial.

WTI Crude Oil Technical Analysis and Short-Term Forecast

The outlook for WTI crude oil remains bullish. The move up is somewhat exhausted though and is struggling to definitively overcome the 62 percent retracement of the decline from $76.07 at $71.9. Even so, rising above $72.2 before falling much lower will clear the way for $72.9 and likely $73.8 and higher in the coming days.

With that said, three daily dojis, one of which is a hanging man, and the wave formation down from $72.43 suggest a test of at least $70.4 and possibly $69.6 will probably take place first. Closing below $69.6 is doubtful but would shift near-term odds in favor of a deeper test of support where $67.8 is the barrier to a firmer bearish outlook.

WTI Crude Oil - $1.00 Kase Bar Chart
WTI Crude Oil – $1.00 Kase Bar Chart

This is a brief analysis for the next day or so. Our weekly Crude Oil Forecast and daily updates are much more detailed and thorough energy price forecasts that cover WTI, Brent, RBOB Gasoline, Diesel, and spreads. If you are interested in learning more, please sign up for a complimentary four-week trial.

Natural Gas Technical Analysis and Near-Term Outlook

Natural gas rose as called for in yesterday’s update and easily pushed through the crucial $3.91 objective as suspected. Closing above $3.91 positions natural gas to challenge $4.00 and possibly higher during the next few days.

With that said, the move up became somewhat hesitant after overcoming $3.91. The move up is also due for a pullback because the larger than (1.618) target of the wave up from $3.52 held. Therefore, a test of $3.87 might take place before rising to challenge $4.00. For now, $3.87 is expected to hold and $3.80 is key support for the near-term outlook. Settling below $3.80 would shift near-term odds in favor of $3.74 and possibly $3.69.

Natural Gas - $0.035 Kase Bar Chart
Natural Gas – $0.035 Kase Bar Chart

This is a brief analysis for the next day or so. Our weekly Natural Gas Commentary and daily updates are much more detailed and thorough energy price forecasts that cover key natural gas futures contracts, calendar spreads, the UNG ETF, and several electricity contracts. If you are interested in learning more, please sign up for a complimentary four-week trial.

WTI Crude Oil Technical Analysis and Short-Term Forecast

The outlook for WTI crude oil remains bearish based on the aggressive decline from $76.07. However, the move down stalled just below the $65.2 larger than (1.618) target of the primary wave down from $76.07 today. Currently, the decline looks like a three-wave correction, but there is a good chance that resistance at $69.0 will hold and the decline could transmute into a five-wave trend that targets $59.5 and possibly $58.4. Such a deep test of support is unlikely without more bearish help from external factors. Nonetheless, falling below $66.0 will call for a test of $65.3 and likely $64.1 during the next few days. Settling below $64.1 would imply that the move down is a five-wave trend and increase odds for a test of targets below $60.0.

With that said, today’s move up from $65.01 helped shape a daily bullish hammer. This is a reversal pattern that warns the corrective move down might already be complete. To complete the hammer WTI must close above $69.0. The connection to $69.0 is made through $68.1, which is the smaller than (0.618) target of the intra-day wave up from $65.01. Settling above $69.0 would then call for a test of the hammer’s $71.1 confirmation point. Closing above this would strongly suggest the move down is complete and call for $71.9 and higher.

WTI Crude Oil - $1.00 Kase Bar Chart
WTI Crude Oil – $1.00 Kase Bar Chart

This is a brief analysis for the next day or so. Our weekly Crude Oil Forecast and daily updates are much more detailed and thorough energy price forecasts that cover WTI, Brent, RBOB Gasoline, Diesel, and spreads. If you are interested in learning more, please sign up for a complimentary four-week trial

Gold Technical Analysis and Near-Term Outlook

Gold challenged $1835 as expected and stalled. This is a bullish decision point for gold because it is in line with the 50- and 200-day moving averages, the 50 percent retracement of the decline from $1919.2, and the smaller than (0.618) target of the primary wave up from $1750.1. Most waves that meet the smaller than target extend to fulfill the equal to (1.00) target, in this case, $1857. Therefore, the outlook for gold is bullish and odds favor a move and close above $1835 soon.

However, the formation of a daily long-legged doji suggests that a test of support will probably take place first. Closing below $1817 will complete the doji and settling below $1802 will confirm the reversal pattern. A move below $1802 is doubtful but would shift near-term odds in favor of a deeper test of support before the move up continues.

Gold - Daily Chart
Gold – Daily Chart

This is a brief analysis for the next day or so. Our weekly Metals Commentary and daily updates are much more detailed and thorough energy price forecasts that cover key COMEX precious metals futures contracts and LME Non-Ferrous (Base) metals, spot gold, the gold/silver ratio, and gold ETFs. If you are interested in learning more, please sign up for a complimentary four-week trial.

Natural Gas Technical Analysis and Near-Term Outlook

Natural gas continues to trade in an erratic range bound between approximately $3.60 and $3.81. Monday’s rise to $3.769 looks as though it was a shortfall (a failure to test the range’s upper trend line) within the range. The waves down from $3.822 and $3.769 are poised to test $3.59. This is the smaller than (0.618) target of the primary wave down from $3.822. Closing below $3.59 would confirm a break lower out of the range and clear the way for $3.54 and likely $3.48 in the coming days.

Nevertheless, prices have risen this afternoon and a test of $3.71 might take place first. This level is expected to hold. Overcoming $3.71 will call for $3.77 and possibly $3.82. Settling above $3.82 would confirm a break higher and shift odds in favor of challenging another highly confluent and major threshold at $3.91.

Natural Gas - $0.035 Kase Bar Chart
Natural Gas – $0.035 Kase Bar Chart

This is a brief analysis for the next day or so. Our weekly Natural Gas Commentary and daily updates are much more detailed and thorough energy price forecasts that cover key natural gas futures contracts, calendar spreads, the UNG ETF, and several electricity contracts. If you are interested in learning more, please sign up for a complimentary four-week trial.

WTI Crude Oil Technical Analysis and Short-Term Forecast

WTI crude oil rose as called for in yesterday’s daily update. WTI settled above the 62 percent retracement of the decline from $76.98 and overcame the $75.36 smaller than (0.618) target of the compound wave up from $69.54. These factors imply that the move down is complete. There is an immediate target at $75.7, a move above which will call for $76.3 and likely $77.3 during the next few days. Settling above $77.3 will clear the way for $78.2 and higher.

WTI Crude Oil - $0.50 Kase Bar Chart
WTI Crude Oil – $0.50 Kase Bar Chart

The $75.7 target is relatively confluent and could prove to be a temporary stalling point. A pullback before overcoming $75.7 will likely be a short-lived correction and should hold $73.7. Key support and the barrier to a bearish outlook during the next few days is $72.5. Settling below this will shift near-term odds in favor of $71.6, which then connects to $69.2 and lower.

This is a brief analysis for the next day or so. Our weekly Crude Oil Forecast and daily updates are much more detailed and thorough energy price forecasts that cover WTI, Brent, RBOB Gasoline, Diesel, and spreads. If you are interested in learning more, please sign up for a complimentary four-week trial.