Crude Oil Price Forecast – July 28, 2020

WTI Crude Oil Price Forecast

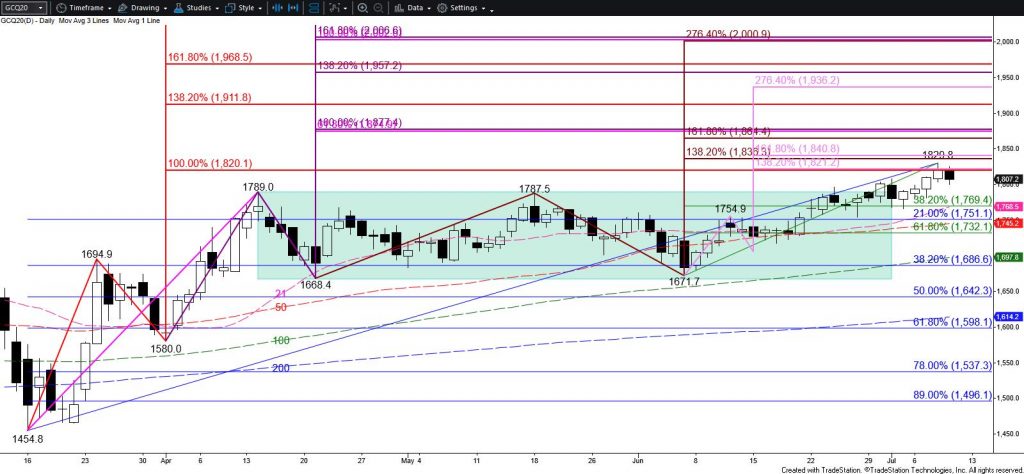
The long-term outlook for WTI crude oil is bullish. However, WTI continues to trade in a very erratic and indecisive manner in the near-term. The move up looks exhausted and some technical patterns and signals suggest a sizable test of support should take place before the move up continues. However, as prices have risen to new highs prior swing lows have held. This is the most basic definition of an uptrend. Also, the 21-day moving average continues to hold on a closing basis.

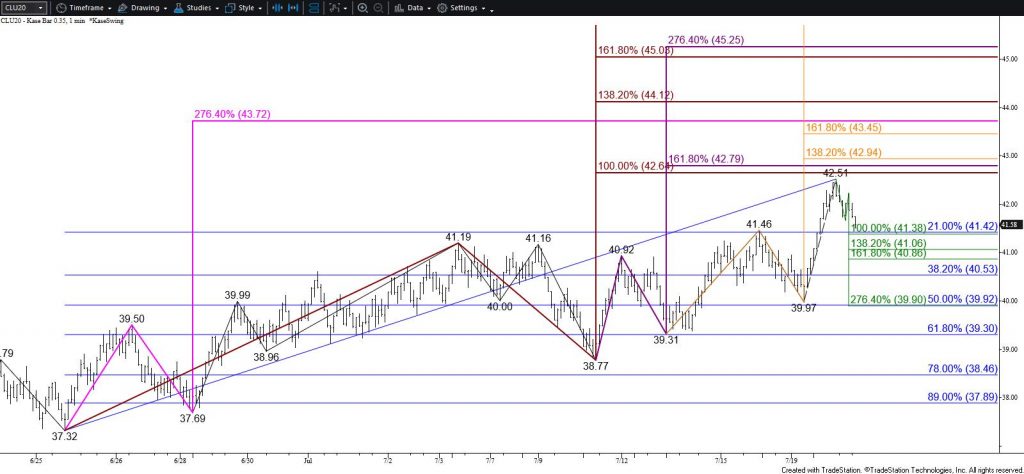
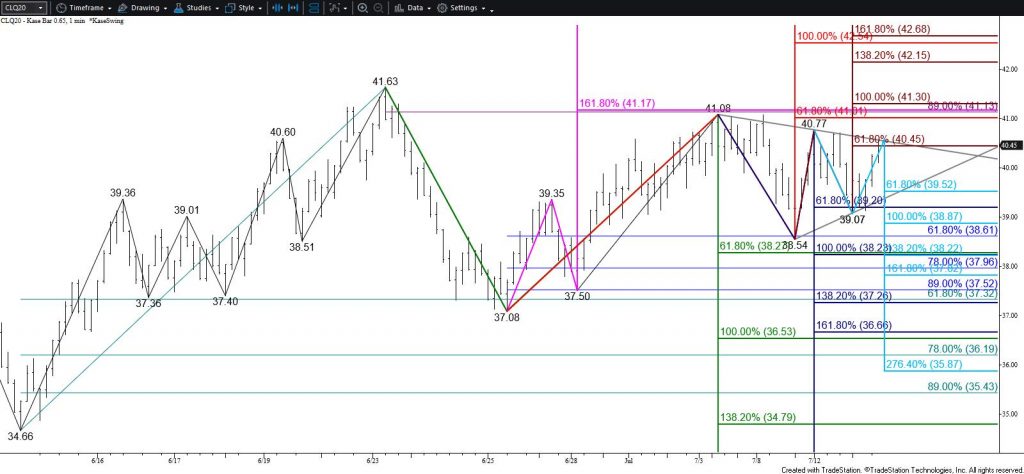
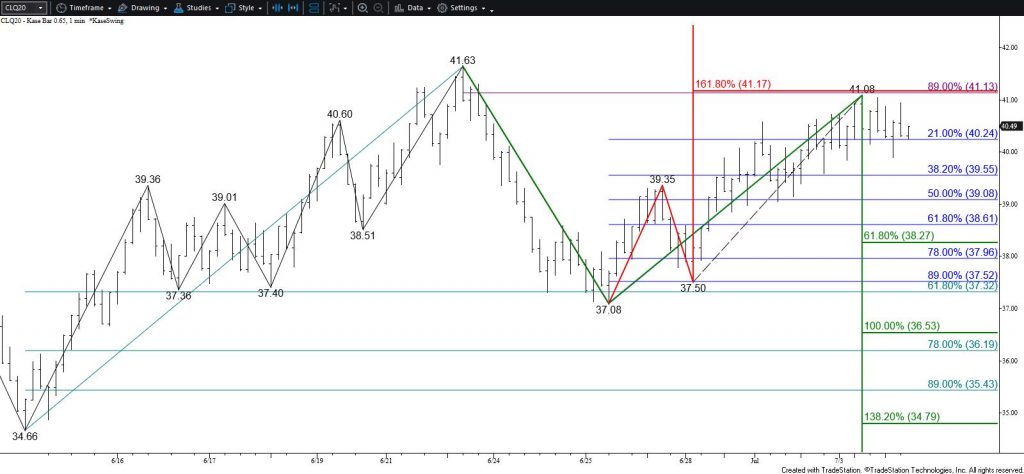
Realistically, the near-term outlook for WTI is neutral. Even so, today’s decline shifts odds nominally in favor of a test of $40.5 and possibly $39.9 tomorrow. These are the smaller than (0.618) and equal to (1.00) targets of the compound wave down from $42.51, respectively. Closing below $40.5 will also take out the 21-day moving average and a close below $39.9 will take out the last swing low of $39.97. This will also increase odds for a deeper correction to $39.2 and possibly $38.6 during the next few days.

WTI Crude Oil – $0.35 Kase Bar Chart

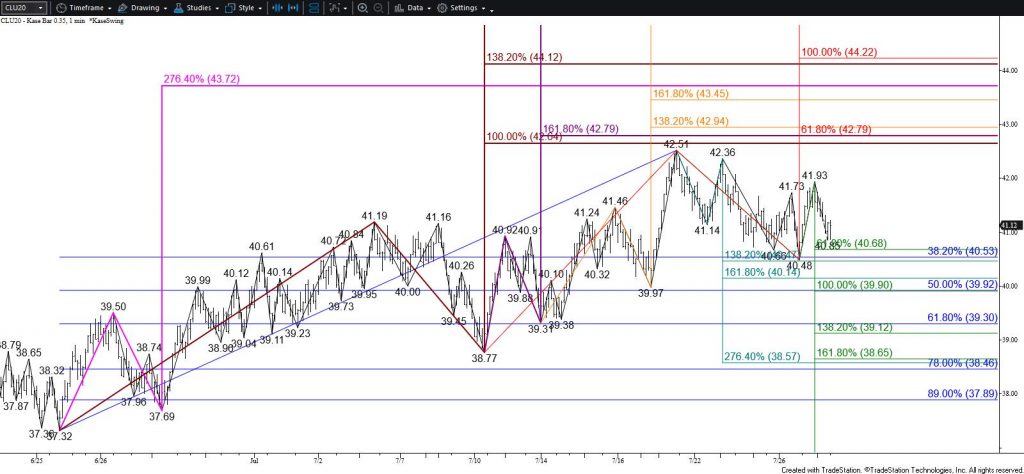
Conversely, each time WTI has looked as though it will break lower prices have turned higher and risen to a modest new high shortly thereafter. Therefore, caution is warranted. Resistance at $41.9 is expected to hold. A move above this would invalidate the wave down from $42.51 that projects to $40.5 and lower. This would also call for WTI to rise to a new high of at least $42.8 before another major test of support takes place.

Brent Crude Oil Price Forecast

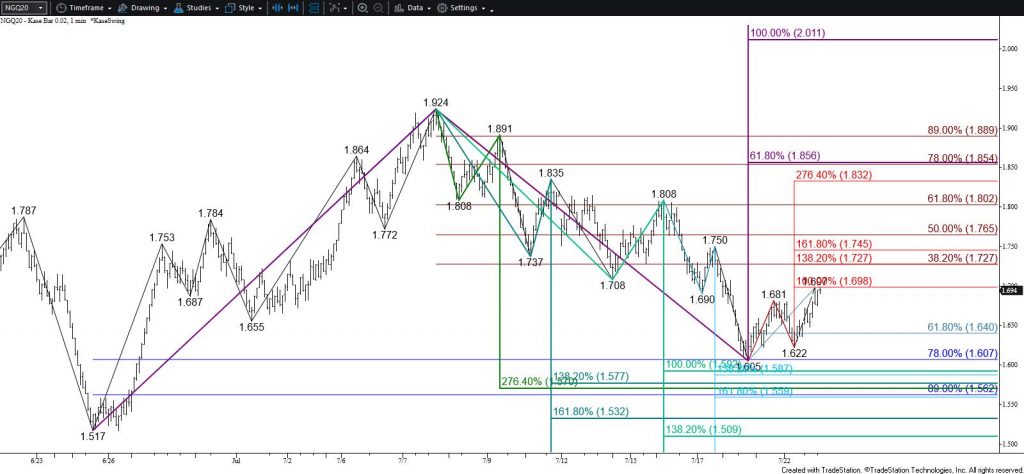
Brent’s near-term outlook leans neutral-to-negative and the move down is poised to challenge at least $43.0. Closing below this will call for $42.1 and possibly lower.

Nevertheless, the 21-day moving average held again today and the move down has been extremely choppy. Therefore, the decline is most likely corrective. Should Brent overcome the $44.34 intra-day swing high look for the move up to extend to $45.3 before another significant test of support takes place.

This is a brief analysis for the next day or so. Our weekly Crude Oil Forecast and daily updates are much more detailed and thorough energy price forecasts that cover WTI, Brent, RBOB Gasoline, Diesel, and spreads. If you are interested in learning more, please sign up for a complimentary four-week trial.

Gold Price Forecast

Gold’s move up finally accelerated this week after breaking higher out of a rectangle pattern on June 30 and then a throwback to test the $1790 breakout point on July 14. The move up has easily overcome targets around $1840 and $1871 this week but stalled this afternoon near $1898. Based on the wave structure, $1898 is a relatively minor target, and odds still favor a move above this to the next major objective at $1912. The $1912 objective is most important because it is the intermediate target of the first wave up from $1694.9 and is in line with the rectangle’s $1909.6 target ($1789 + ($1789 – $1668.4) = $1909.6). Therefore, once $1912 is met another modest test of support is expected before the move up continues.

Gold Targets $1912

There are no confirmed bearish reversal patterns or signals that call for a major test of support before reaching $1912. Nevertheless, the daily RSI and KasePO momentum oscillators have risen into overbought territory. This warns that a test of support will probably take place soon and suggests that $1912 will hold, at least initially.

The small move down from the $1898 confluence point also warns that a small test of support might take place before gold reaches $1912. Support at $1872 is expected to hold and $1853 is key for the near-term. Settling below $1853 would call for $1831 and possibly $1808 before gold rises toward $1912 again.

This is a brief analysis for the next day or so. Our weekly Metals Commentary and daily updates are much more detailed and thorough energy price forecasts that cover key COMEX precious metals futures contracts and LME Non-Ferrous (Base) metals, spot gold, the gold/silver ration, and gold ETFs. If you are interested in learning more, please sign up for a complimentary four-week trial.

Natural Gas Price Forecast

Natural gas rallied again today after falling to $1.622 in early trading hours. The subsequent move up met the $1.698 equal to (1.00) target of the wave up from $1.605. This wave is now poised to reach its $1.73 intermediate (1.382) target tomorrow. This is also the 38 percent retracement of the decline from $1.924 and is in line with the 21-day moving average. Closing above $1.73 would imply that support around $1.60 will continue to hold and that prices are settling into a wide trading range between nominally $1.60 and $1.86 for the interim.

Natural Gas – $0.02 KaseBar Chart

Nevertheless, the move up may still be corrective, and until at least $1.73 is overcome there is still a reasonable chance for the move down to extend. For now, though, support at $1.64, the 62 percent retracement of the rise from $1.605, is expected to hold. Falling below this will call for another attempt at $1.59. Settling below $1.59 would confirm a break below the critical $1.60 level and shift near-term odds in favor of $1.51 and possibly lower before the August contract expires on July 29.

This is a brief analysis for the next day or so. Our weekly Natural Gas Commentary and daily updates are much more detailed and thorough energy price forecasts that cover key natural gas futures contracts, calendar spreads, the UNG ETF, and several electricity contracts. If you are interested in learning more, please sign up for a complimentary four-week trial.

WTI Crude Oil Price Forecast

Today’s move up was bullish for the outlook of WTI crude oil. The August contract settled above $41.2 and September closed above $41.5. This finally confirmed a break higher out of a weeks-long narrowing trading range and clears the way for the next leg of the move up toward at least $42.6, likely $43.5, and possibly $44.3 during the next few days.

The $42.6 objective is the equal to (1.00) target of the primary wave up from $37.32. Today’s move up stalled just below $42.6, so settling above this will clear the way for $43.5. This is a moderately confluent wave projection and, most importantly, is in line with the 200-day moving average on the continuation chart. Therefore, $43.5 may be a stalling point.

Nonetheless, based on September’s wave formation, once September WTI settles above $42.6 there is a good chance for $44.3. This is the intermediate (1.382) target and is also in line with September’s 200-day moving average.

WTI Crude Oil – $0.35 Kase Bar Chart

Either way, there is a lot of important resistance between $43.5 and $44.3. Therefore, another reasonably significant test of support is expected before WTI settles above $44.3.

There is also a good chance for a test of $40.8 early tomorrow before the move up continues. This is because today’s long upper shadow suggests traders remain hesitant to keep risk on overnight. This move down from $42.51 was likely profit-taking but formed a wave that projects to $40.8 as the larger than (1.618) target. This is also today’s open. Support at $40.8 must hold for the move up to extend above $42.6 during the next few days. Falling below $40.8 will call for key near-term support at $39.9. Settling below $39.9 would shift near-term odds in favor of $39.3 and possibly $38.2.

Brent Crude Oil Price Forecast

Brent finally settled above $43.9 and broke higher out of its recent trading range. The move up is poised to reach $45.0, a close above which would call for $45.7 and likely $46.4. The $46.4 objective is the most confluent wave projection. Therefore, another small test of support is expected once $46.4 is met.

The decline at the end of the day formed a long upper shadow on the daily candlestick. This was likely profit-taking but suggests traders remain nervous about the prospects for a larger move up in the coming days. There is also a small wave down from $44.89 that projects to $43.2. This is in line with today’s open and is expected to hold. Key support is $42.3, a close below which would call for $41.7 and likely $40.7.

This is a brief analysis for the next day or so. Our weekly Crude Oil Forecast and daily updates are much more detailed and thorough energy price forecasts that cover WTI, Brent, RBOB Gasoline, Diesel, and spreads. If you are interested in learning more, please sign up for a complimentary four-week trial.

Gold Price Forecast

Gold’s move up has been lackluster after breaking higher out of a rectangle pattern on June 30. The move up fulfilled an important target at $1820, but since then, a throwback to test the breakout point of the rectangle around $1790 has taken place. Throwbacks are common and on Tuesday the correction down from the $1829.8 swing high stalled at $1971.1. However, the subsequent move back up stalled at $1819.5 and today’s price action fulfilled the smaller than (0.618) target of the wave down from $1829.8. Therefore, near-term odds favor a test of at least $1781 and possibly $1767 before the move up continues. There are the equal to (1.00) and intermediate (1.382) targets of the wave down from $1829.8, respectively.

Gold – Daily Candlesticks with Kase Trend and the Kase Easy Entry System (KEES)

Support at $1767 is also in line with the 38 percent retracement of the rise from $1671.1. This target is expected to hold. Settling below $1767 will significantly dampen odds for a continued rise to target above $1820 during the next few weeks. This will also clear the way for $1753 and possibly a test of key lower support at $1732.

Conversely, the long-term outlook remains bullish, so once $1781 is met odds for another test of $1820 will begin to increase. Settling above $1820 will open the way for the next leg of the move up to $1837 and higher.

This is a brief analysis for the next day or so. Our weekly Metals Commentary and daily updates are much more detailed and thorough energy price forecasts that cover key COMEX precious metals futures contracts and LME Non-Ferrous (Base) metals, spot gold, the gold/silver ration, and gold ETFs. If you are interested in learning more, please sign up for a complimentary four-week trial

Natural Gas Price Forecast

Natural gas could not break support at $1.70 and make the push for $1.66 during the last few days. Support at $1.70 is the larger than (1.618) target of the first wave down from $1.924 (dark cyan) and is marginally below the 50 percent retracement of the rise from $1.517 (blue). The subsequent wave up from $1.708 (orange) accelerated this afternoon and is testing its equal to (1.00) target and the 38 percent retracement of the decline from $1.924 (dark red). This is positive for the near-term outlook.

Natural Gas – $0.02 KaseBar Chart

Because $1.70 held and based on this afternoon’s move up, near-term odds have shifted in favor of challenging at least $1.84 tomorrow. This is the larger than target of the wave up from $1.708 (orange) and the 62 percent retracement of the decline from $1.924 (dark red). Settling above this will call for $1.91, which then connects to $1.96 and higher.

Nevertheless, while $1.84 holds, there is a modest chance for the move down to extend to $1.66. Falling below the $1.728 swing low will increase odds for $1.66 because this would invalidate the wave up from $1.708 (orange) that makes the connection to $1.84 and $1.91. Support at $1.66 is key for the near-term outlook and is expected to hold. Closing below this would call for another test of $1.59 and possibly lower.

This is a brief analysis for the next day or so. Our weekly Natural Gas Commentary and daily updates are much more detailed and thorough energy price forecasts that cover key natural gas futures contracts, calendar spreads, the UNG ETF, and several electricity contracts. If you are interested in learning more, please sign up for a complimentary four-week trial.

WTI Crude Oil Price Forecast

WTI crude oil has traded in a narrowing range that likely forms a bullish coil after stalling at $41.08 late last week. Most trend indicators on the daily chart still lean bullish and the wave formations continue to call for another test of $41.2 after holding support near $39.2 today. This is because the most recent wave up from $38.54 met its smaller than (0.618) target this afternoon. Most waves that meet the smaller than target extend to at least their equal to (1.00) target, in this case, $41.2.

The $41.2 objective has been resilient resistance for the past few weeks. It is the most confluent wave projection for the August contract and is in line with the March 9 gap down from $41.05 on the continuation chart. Settling above $41.2 will be quite bullish for the near-term outlook, clearing the way for $42.5 and likely higher.

WTI Crude Oil – $0.65 Kase Bar Chart

Nevertheless, during the past few weeks, each time WTI looks as though it is ready to overcome $41.2 the move up stalls. Therefore, caution is warranted as it will likely take help from external factors for WTI to finally settle above $41.2 and make the push for the next leg of the larger scale move up.

Conversely, should WTI fall below $39.5, the coil will break lower and the move down should then extend to at least $38.8 and likely $38.2. Support at $38.2 is key for the near-term because it is the smaller than target of the wave down from $41.63. Closing below this will open the way for an extended downward correction to $36.5 and possibly lower.

Brent Crude Oil Price Forecast

Brent is trading in a sideways narrowing range that forms a bullish coil. Odds favor a break higher out of the coil and a test of $43.9. This is the most confluent objective and a key target because a close above $43.9 will clear the way for the next leg of the move up to $45.2 and higher.

Nonetheless, during the past few weeks, each time Brent is poised to challenge $43.9 the move up has stalled. Should Brent fall below $42.0 first the coil will break lower and odds will shift in favor of $41.0. This is the smaller than (0.618) target of the primary wave down from $43.97 and connects to $39.4 and lower.

This is a brief analysis for the next day or so. Our weekly Crude Oil Forecast and daily updates are much more detailed and thorough energy price forecasts that cover WTI, Brent, RBOB Gasoline, Diesel, and spreads. If you are interested in learning more, please sign up for a complimentary four-week trial.

Gold Price Forecast

Gold finally broke higher out of the rectangle pattern that began to form in mid-April. A sustained close above $1790 confirmed the break high and the next objective around $1820 has already been met. The move up stalled at $1829.8, and today’s decline suggests a test of the $1790 breakout point might take place before the move up continues. A throwback to the breakout point of a pattern like a rectangle is common. Therefore, $1790 is expected to hold.

The long-term outlook for gold remains bullish and a close back above $1820 will clear the way for $1836 and higher. The next major objective above $1820 is $1912. This is a highly confluent wave projection and is in line with the rectangle’s $1909.6 target ($1789 + ($1789 – $1668.4) = $1909.6).

Gold – Break Higher Out of Daily Rectangle

Should gold close below $1790, odds for a continued rise during the next few days will be significantly dampened. Key near-term support is $1770. Settling below $1770 would reflect a bearish shift in sentiment and imply that the recent move above $1790 was a false break higher out of the rectangle pattern.

This is a brief analysis for the next day or so. Our weekly Metals Commentary and daily updates are much more detailed and thorough energy price forecasts that cover key COMEX precious metals futures contracts and LME Non-Ferrous (Base) metals, spot gold, the gold/silver ration, and gold ETFs. If you are interested in learning more, please sign up for a complimentary four-week trial.

Natural Gas Price Forecast

Natural gas has adopted a bullish outlook for the remaining summer months after rallying to a high of $1.924. This was the equal to (1.00) target of the August contract’s primary wave up from $1.517 and was in line with the 50-day moving average. However, today’s bearish engulfing line calls for a deeper test of support before the move up continues above $1.92 to challenge $1.98 and higher.

Based on the wave formation down from $1.924 and the retracements of the move up from $1.517, August natural gas should fall to at least $1.78 and likely $1.73 before settling above $1.92. The $1.73 objective will most likely hold. Once this target is met, odds for another test of $1.92 will begin to increase.

Natural Gas – $0.02 KaseBar Chart

Nevertheless, closing below $1.73 would call for key support at $1.67 to be challenged. This is the larger than (1.618) target and the 62 percent retracement. Settling below $1.67 is doubtful but would reflect a bearish shift in external factors (e.g. weather and/or supply and demand). This would then call for another test of $1.60 and possibly lower.

During the next day or so, as prices fall to challenge support, resistance at $1.88 should hold. Rising above this will call for another test of $1.92. An eventual close above $1.92 is expected and will clear the way for $1.98 and higher.

This is a brief analysis for the next day or so. Our weekly Natural Gas Commentary and daily updates are much more detailed and thorough energy price forecasts that cover key natural gas futures contracts, calendar spreads, the UNG ETF, and several electricity contracts. If you are interested in learning more, please sign up for a complimentary four-week trial.

WTI Crude Oil Price Forecast

The long-term outlook for WTI crude oil is bullish. However, prices are struggling to overcome a crucial target at $41.2. This is a highly confluent projection for the waves and sub-waves up from $20.28 and the larger than (1.618) target of the primary wave up from $37.08 on the August chart. Most importantly, $41.2 is in line with the March 9 gap down from $41.05 on the continuation chart. So far $41.2 has held on a closing basis. Settling above this will clear the way for $42.2 and likely a push to targets in the range of $43.6 to $45.0.

WTI Crude Oil – $0.65 Kase Bar Chart

Nevertheless, Monday’s high-wave candlestick and today’s hanging man pattern reflect uncertainty and a rising degree of hesitance to rise above $41.2. These patterns also suggest another test of support might take place first. Any move down will most likely prove to be corrective. Should WTI fall below $39.6, look for a test of key near-term support at $38.5. This is split between the 62 percent retracement of the move up from $37.08 and the smaller than (0.618) target of the wave down from $41.63. Settling below $38.5 is doubtful but would call for $38.0 and likely $36.5, the latter of which is the equal to (1.00) target.

Brent Crude Oil Price Forecast

Brent has held $43.8 so far this week. This is the last target protecting the $43.97 swing high. Odds still favor an eventual close above $43.8, which will open the way for $44.6 and higher. However, Monday’s shooting star and today’s high wave candlestick suggests a test of $42.2 and possibly $41.1 might take place first. Support at $41.1 is key and is expected to hold. Closing below $41.1 will call for a deeper correction to $40.1 and likely $39.4 before the move up continues.

This is a brief analysis for the next day or so. Our weekly Crude Oil Forecast and daily updates are much more detailed and thorough energy price forecasts that cover WTI, Brent, RBOB Gasoline, Diesel, and spreads. If you are interested in learning more, please sign up for a complimentary four-week trial.